Use basic formulae to work with data and then chart the results
IN THE PREVIOUS TUTORIAL, WE WORKED THROUGH
the basics of creating a table and Riling it with content. Of course, much of the point ofspreadsheets is not in merely displaying information but in manipulating and processing data. In the walkthrough here we look at two features of Numbers that do just that.
The first feature is the use ofa formula - in our example, to calculate an average from a column of numbers. Of course this is one of the most basic formulae you can use in a spreadsheet, but what we're interested in is how the process works in Numbers.
The second feature is the ability to link a chart to a table. With charts that are dynamically updated, Numbers makes displaying data in a visually appealing way both easy and quick, and it's worth noting that you can potentially save yourself even more time. When you create a new spreadsheet, take a good look at the 15 templates supplied as they can be readily adapted to your needs. Examples Apple has provided foryou to experimentwith include a combined weight-loss and running log, documents related to office administration (invoices, expenses, employee schedules) and a mortgage calculator.
While working on the walkthrough, we noticed that fields would occasionally 'forget' values and semi-randomly revert to being blank. Hitting the 'Home' button, relaunching Numbers and opening the spreadsheet again seemed to deal with this.
KIT LIST:
■ IPad
■ Numbers for iPad
Time required: 15 mins
■ IPad
■ Numbers for iPad
Time required: 15 mins
Difficulty: Intermediate
Charting your data
Charts can be linked to tables or portions of tables, and they dynamically update as you add more data.
Adding formulae
Although most people get by with basic formulae when using spreadsheets, Numbers provides scope for spreadsheet gurus with more demanding needs.
Intelligent keyboard
The Numbers keyboard changes to match the type of data you're inputting, providing access to relevant commands and characters.
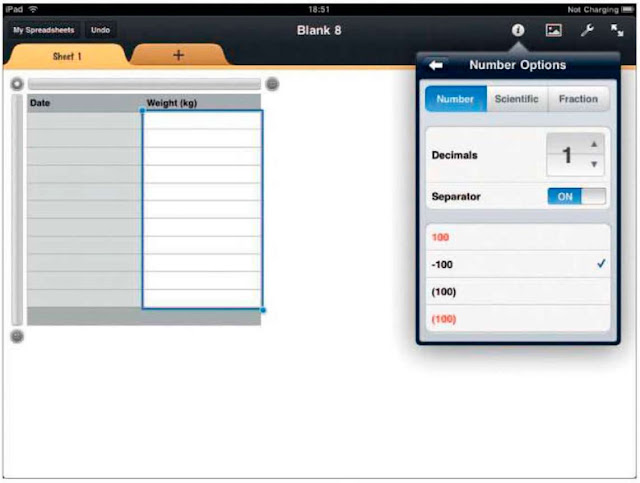
1 Create a table Set up a two-column table akin to the one in the previous tutorial, but ignore step 3 and leave header columns in place. In the 'Headers' tab of the Info menu, set 'Footer Rows' to 1.
2 Define the columns Set the format ofthe left-hand column to a date with no time (see step 6 ofthe previous tutorial) and the weight column to the number format with one decimal point.
2 Define the columns Set the format ofthe left-hand column to a date with no time (see step 6 ofthe previous tutorial) and the weight column to the number format with one decimal point.
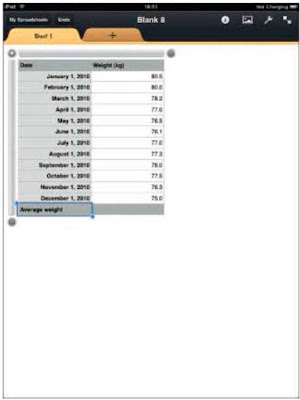
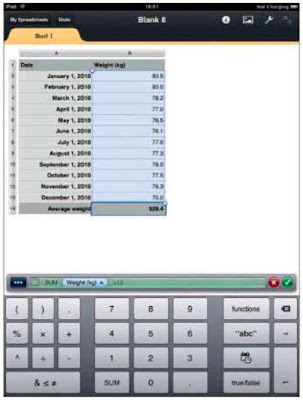
4 Add a formula Double-tap the bottom right cell and tap the '=' button. To find the average, tap 'SUM' and type '+12'. Tap the tick mark to finish.
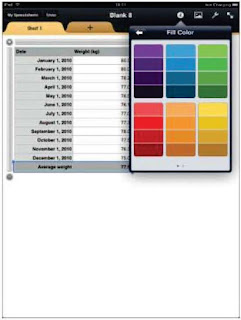
6 Add a chart from the Insert button, select the 'Charts' tab and the type of chart to link to your table. You can swipe to see additional choices.
Quick change
If you need to to change some specific values in your tables, it's good to make use of the find-and-replace functionality within Numbers (and, indeed, throughout the iWorks suite). Select 'Find' from the Tools menu, and tap the cog icon to access the 'Find' options. Tap 'Find and Replace', type your terms into the two fields provided, and then tap 'Replace'.7 Link the chart Double-tap the chart, then tap the weight column's header. Numbers should automatically plot all of the values. If not, move the drag handle at the bottom right.
8 Improve the layout With layouts that involve a table and chart, it's often better to use your iPad in landscape view and resize the page components so they take up more of the screen.


No comments:
Post a Comment